
Climate-driven range shifts
Describing subpopulation range shifts of a migratory fish
 Pavel Dimens
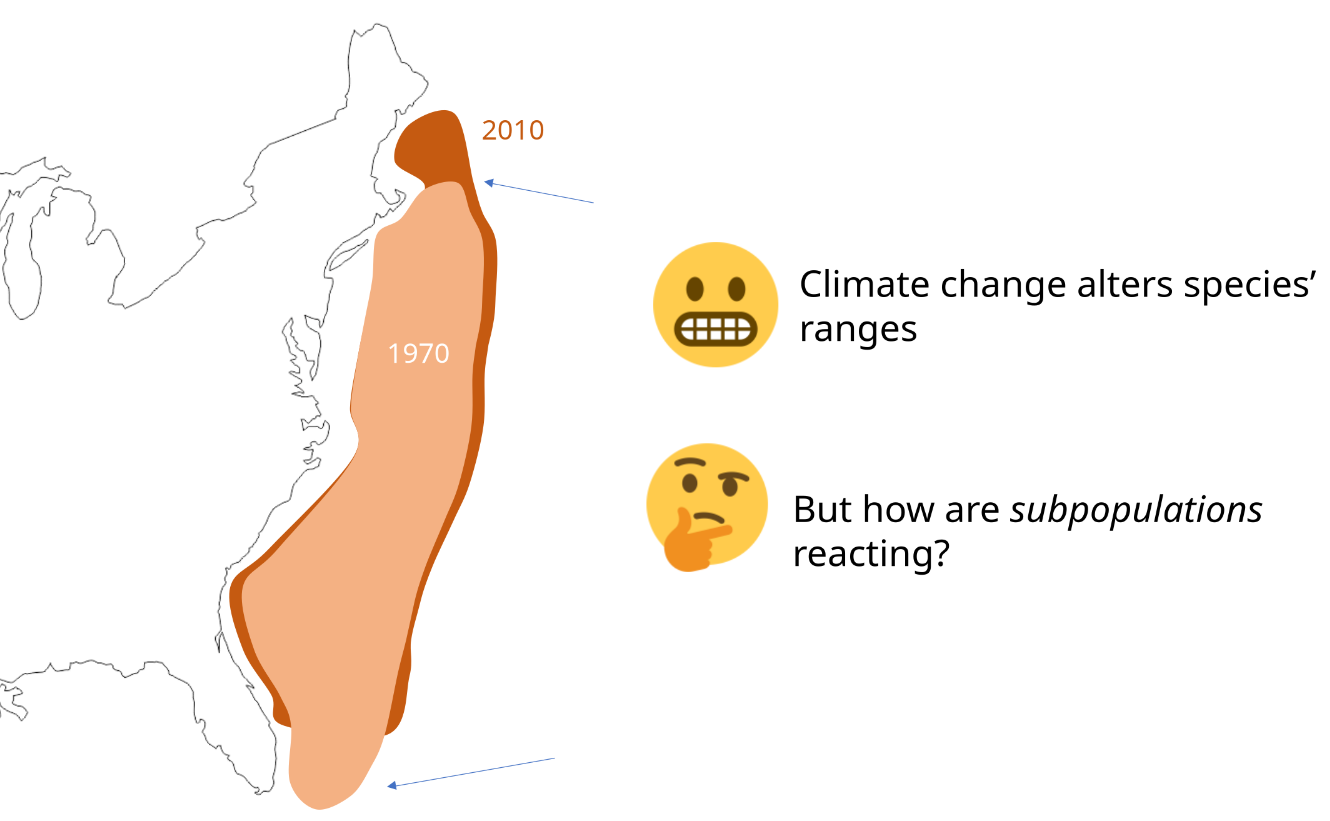
 Climate change is causing many species to shift where they live, but most research has focused on entire species rather than the individual populations that make them up. This matters because populations can be genetically distinct and locally adapted, meaning they may respond differently to environmental change. Understanding whether range shifts happen because populations move, expand, or disappear is key to predicting how species will adapt and persist over time.
 The project, in a nutshell
Anadromous fish like American shad, which are born in rivers and migrate to the ocean before returning to spawn, offer a unique opportunity to study these dynamics. While most individuals return to their birth river, some “stray” into new rivers, potentially introducing gene flow between populations. Climate change may influence this behavior, pushing fish toward more favorable conditions and altering patterns of movement and reproduction. These changes can have important consequences for population structure, adaptation, and long-term resilience.
American shad (Alosa sapidissima) are an especially valuable system for studying population-level range shifts. Once abundant along the U.S. East Coast, their populations declined due to overfishing, habitat loss, and other human impacts. Despite recovery efforts, numbers remain low. However, strong natal homing and clear genetic differences between river populations make it possible to track where individuals come from and how populations change over time. With access to both historical and modern genetic data, we are directly examining how climate-driven range shifts are affecting individual populations across the species’ range.
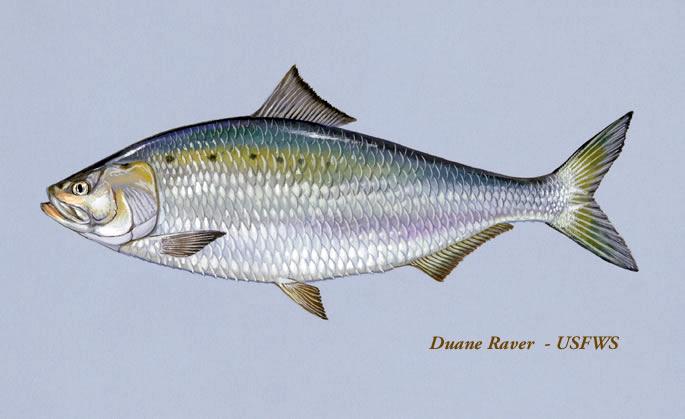 Our friend, the American shad (Alosa sapidissima)
The American shad are somewhat tricky to study because they have been so heavily stocked in recent decades, which may artificially modify what "gene flow" looks like. We have carefully chosen rivers represented in the historical data that are likely not to have been impacted by the intense stocking efforts. Stay tuned as Pavel prepares these many samples using the cutting-edge Haplotagging sequencing technology to get to the bottom of this.
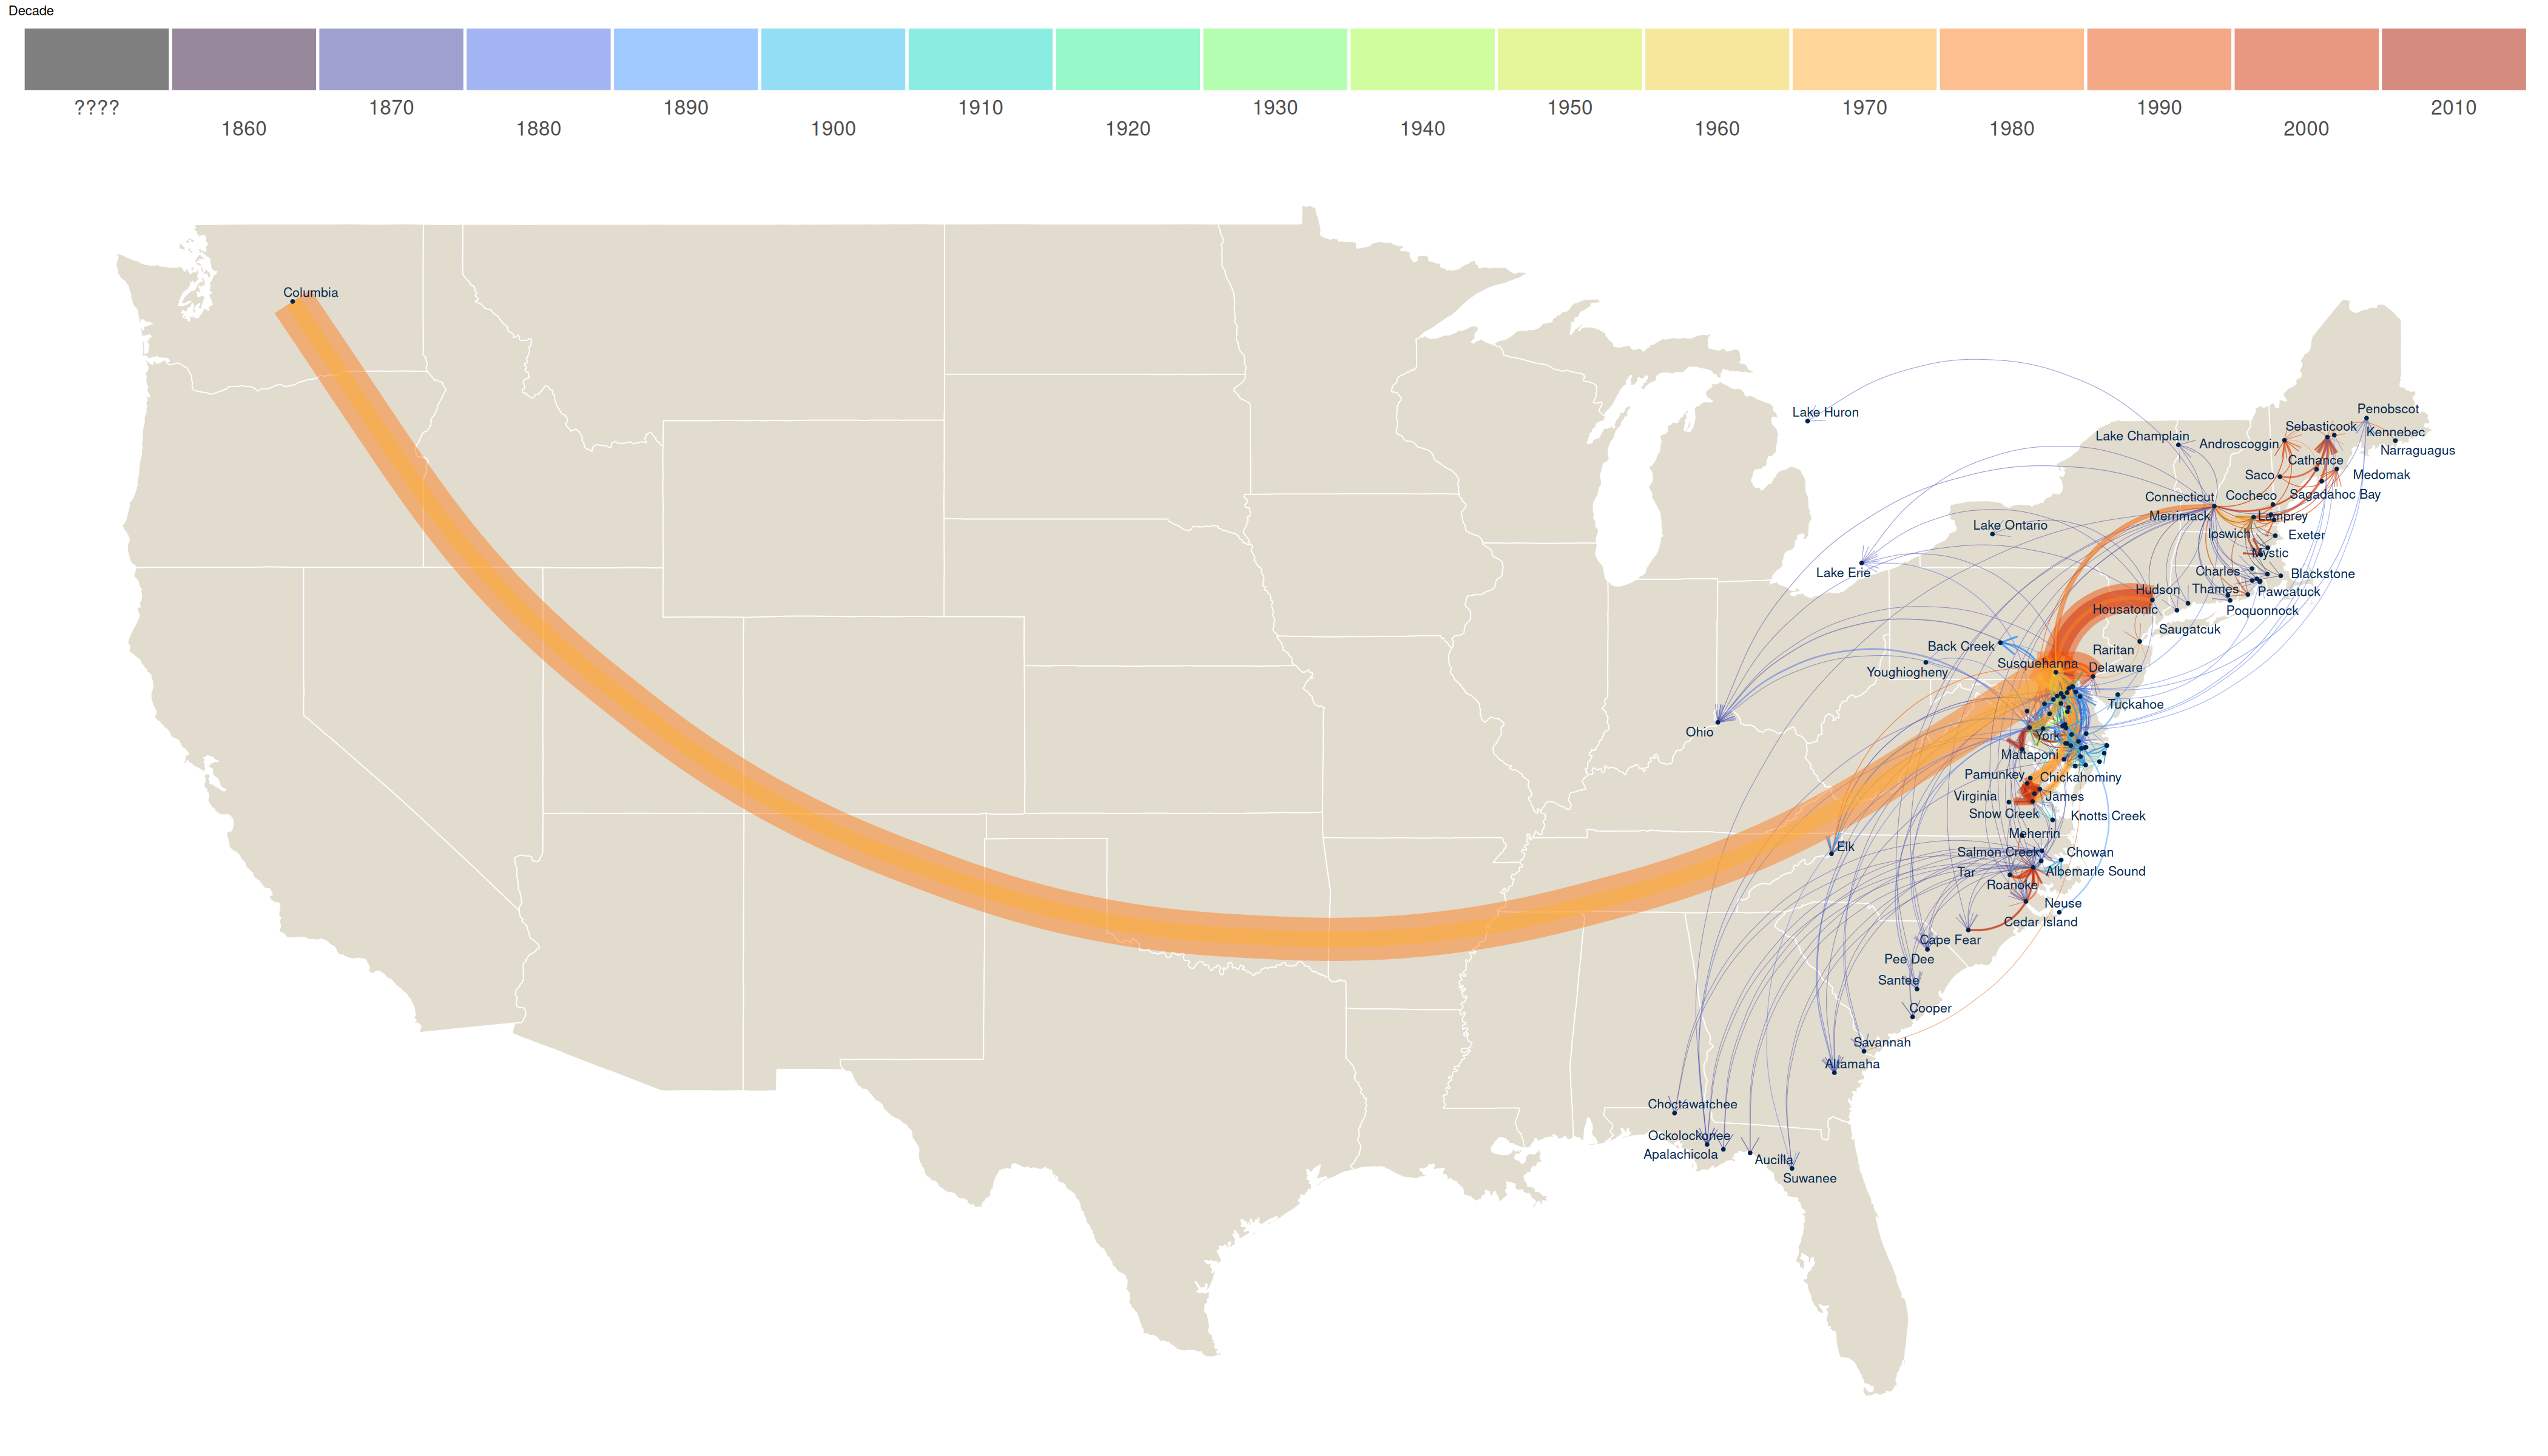 Data compiled by Dan Hasselman, visualized by Pavel Dimens. Arrow thickness indicates relative stocking volume.